

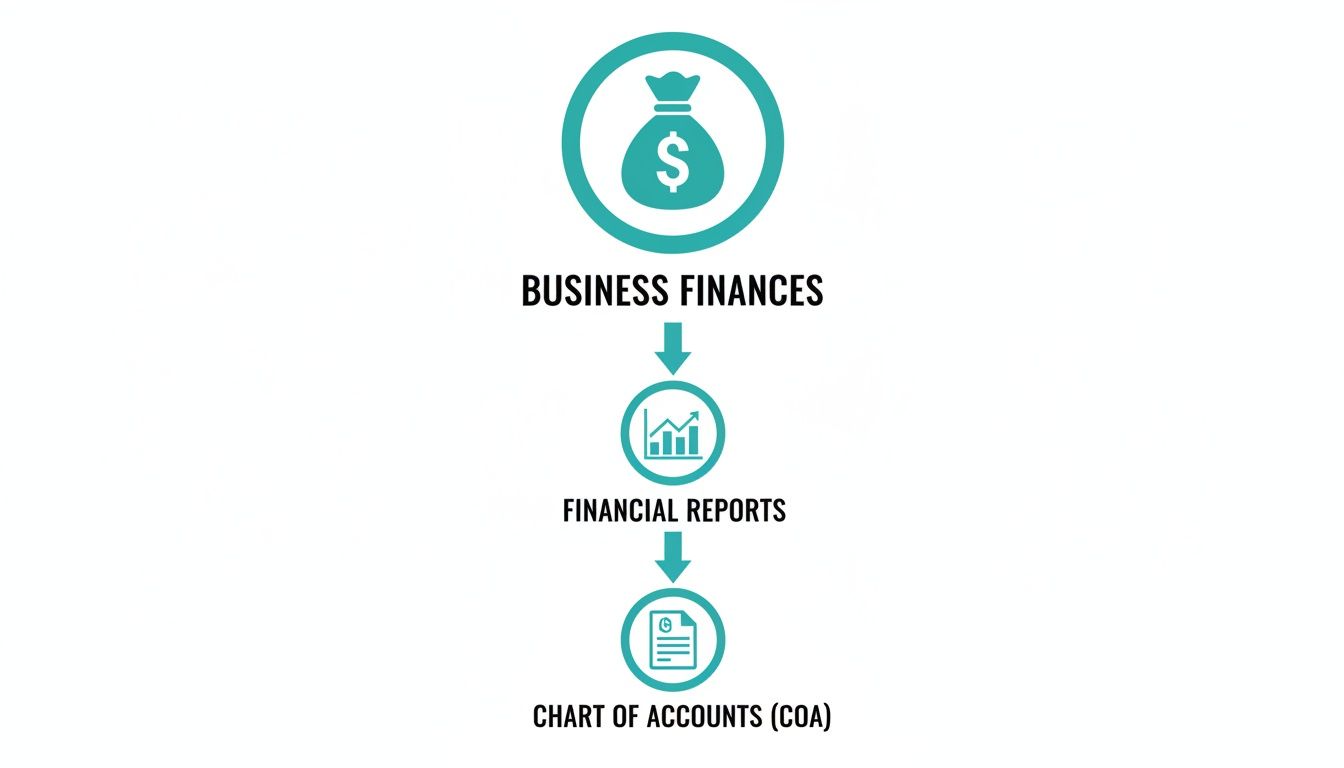
A chart of accounts is basically a complete, organized list of every single financial account in your company's general ledger. Think of it as the foundational backbone for your entire accounting system, making sure every dollar and cent that moves through your business ends up in the right place.
Your Company's Financial Blueprint
I like to explain the chart of accounts (COA) as the financial equivalent of the Dewey Decimal System. A library needs a logical way to organize thousands of books into categories like "Fiction," "History," and "Science," right? Your COA does the exact same thing for your money, sorting every transaction into specific, meaningful buckets.
Without this system, your financial data would just be a chaotic jumble of numbers. It would be nearly impossible to figure out what's really going on with your business.
This organized structure is what makes generating clear and accurate financial statements possible. Every single line you see on a profit and loss statement or a balance sheet ties directly back to an account in your COA. When you pay for your web hosting and categorize it under "Software & Subscriptions," that transaction gets filed correctly, ready to be totaled up later. This process is what gives you a precise picture of where your money is actually going.
A well-organized COA helps create financial reports that are easy to understand and act upon.
It's All About Making Better Decisions
A thoughtfully structured chart of accounts does a lot more than just keep your books tidy—it turns raw financial data into a powerful tool for making smart business decisions. When you track your income and expenses accurately, you can finally start answering critical questions about your company's health.
- Are your services actually profitable? A good COA helps you drill down and see which product lines or services are making you money and which are draining your resources.
- Where is the money going? You can easily spot which expense categories are creeping up, giving you a chance to get costs under control before they become a problem.
- How healthy is the business? By comparing assets to liabilities, you get a clear, real-time look at your financial position.
Getting this kind of insight is only possible if the underlying framework—your COA—is solid. Before we dive into the specific account types, let’s quickly break down the five main categories that form the bedrock of every chart of accounts.
The Five Core Account Types in a Chart of Accounts
Every transaction your business makes will fall into one of these five fundamental categories. Understanding their role is the first step to building a COA that works for you.
| Account Type | What It Represents | Normal Balance |
|---|---|---|
| Assets | Everything your company owns that has value (cash, equipment, inventory). | Debit |
| Liabilities | Everything your company owes to others (loans, credit card balances, accounts payable). | Credit |
| Equity | The net worth of the business (owner's investment minus withdrawals, retained earnings). | Credit |
| Revenue/Income | All the money the business earns from sales of goods or services. | Credit |
| Expenses | All the money the business spends to operate (rent, payroll, marketing). | Debit |
These five account types are the building blocks. A good COA simply breaks them down further into more specific sub-accounts that make sense for your particular business.
A chart of accounts isn't just a list for your bookkeeper. It's the foundational language your business uses to talk about money. When that language is clear and consistent, everyone from the owner to an investor can understand the story your finances are telling.
Ultimately, you need to see your COA as a strategic asset, not just an administrative chore. It provides the clarity required to generate a reliable profit and loss report, which is essential for steering your business toward sustainable growth. By taking the time to set it up correctly from the start, you’re building a solid foundation for every financial decision you'll ever make.
How to Structure Your Chart of Accounts
Think of structuring your chart of accounts like drawing up the blueprints for a house before you ever break ground. A logical, well-organized structure ensures every single financial transaction has a proper home, which in turn makes your financial reports clear and easy to understand. The whole idea is to move from broad categories down to the nitty-gritty details, just like zooming in on a map.
The entire system is built on the five core account types we've already covered: Assets, Liabilities, Equity, Revenue, and Expenses. These are your highest-level "parent" accounts. From there, you'll create more specific "sub-accounts" to capture the finer details of how your business really operates.
For example, you might have a parent expense account called "Marketing." But what does that really mean? By creating sub-accounts underneath it for "Social Media Advertising," "Email Marketing Software," and "Content Creation," you can see both your total marketing spend at a glance and drill down to see exactly how much you dropped on that last Facebook campaign.
This visual hierarchy is the critical link between your day-to-day finances and your big-picture financial reports.
It’s this process that transforms a pile of raw financial data into organized, actionable insights you can actually use to make smart decisions.
The Logic of Account Numbering
So, how do you keep this structure from becoming a tangled mess? A smart numbering system is the secret sauce. By assigning a specific range of numbers to each of the five main account types, you create an orderly framework that’s instantly recognizable. This isn't just for bookkeepers; it makes finding and categorizing transactions faster and more intuitive for everyone.
A standard, battle-tested numbering convention looks something like this:
- 1000s for Assets: Think Checking, Savings, and Accounts Receivable.
- 2000s for Liabilities: This is where you'll find Credit Cards, Loans Payable, and Accounts Payable.
- 3000s for Equity: Accounts like Owner's Investment and Retained Earnings live here.
- 4000s for Revenue: All your income streams, from Service Fees to Product Sales.
- 5000s for Expenses: Covers all your operating costs, from Rent to Payroll.
This system provides a clear, logical flow that perfectly mirrors the layout of your financial statements. The moment you see an account starting with a "1," you know it's an asset. No guesswork needed.
Putting Structure into Practice
Let's see how this hierarchy and numbering system click together in the real world. A parent account will typically get a round number (like 6100), and its sub-accounts will follow in sequence (6110, 6120, etc.). This creates those clean, nested categories that make your reports so much easier to read.
Take a look at this example from QuickBooks. You can see how the parent and sub-accounts are organized to tell a clear story. "Automobile Expense" is the main category, and specific costs like fuel and insurance are neatly indented right below it. Simple. Effective.
A well-structured chart of accounts basically sets the ceiling for your financial analysis. If a category doesn't exist in your COA, you can't generate a report on it. It’s the very framework that determines how deep your business insights can go.
The level of detail you need really depends on your business. A small local shop might get by with 50–300 accounts, while larger enterprises often need 500–5,000 account codes to get the clarity they require. As accounting experts at Snyder Cohn point out, you can't pull a report for something you aren't tracking, and your COA defines what you can track.
Distinguishing Key Expense Types
One of the most common points of confusion for business owners is the difference between regular Expenses and the Cost of Goods Sold (COGS). While they're both technically expenses, they tell very different stories about your company's financial health.
- Cost of Goods Sold (COGS): These are the direct costs tied to producing what you sell. If you run a retail shop, this is what you paid for your inventory. For a contractor, it includes materials and the labor directly tied to a job.
- Expenses (or Operating Expenses): These are the indirect costs of simply keeping the lights on. Think rent, marketing salaries, software subscriptions, and office supplies.
Separating these two is non-negotiable because it’s how you calculate your gross profit—a vital metric for understanding how efficiently your core business is running. A good COA gives COGS its own dedicated section, usually in the 5000 range, to keep it completely separate from your other operating expenses. You can dive deeper into this topic with our guide on understanding Cost of Goods Sold.
Customizing Your COA for Different Industries
A generic chart of accounts tells a generic story. While the default COA in your accounting software is a decent starting point, it’s like being handed a one-size-fits-all t-shirt when you really need a tailored suit. To get financial reports that are actually useful for making decisions, you need a chart of accounts that speaks your business’s unique language.
This means getting practical and structuring your accounts to mirror what actually drives revenue and costs in your industry. The financial world of a construction firm is miles apart from that of a software-as-a-service (SaaS) company, and their COAs have to reflect that. A smart customization turns your financial data from a simple record into a powerful strategic tool.
Construction Job Costing vs. SaaS Revenue Streams
Let's dive into two completely different business models to see this in action. A construction company lives and dies by the profitability of each individual project. That demands a highly detailed chart of accounts built around job costing.
For a builder, a single "Materials" expense account is almost useless. It tells them nothing. Instead, they need specific sub-accounts to track costs for every single job:
- 5100 Cost of Goods Sold
- 5110 Project A – Lumber
- 5120 Project A – Concrete
- 5130 Project B – Lumber
- 5140 Project B – Electrical Supplies
- 5200 Subcontractor Costs
- 5210 Project A – Plumbing Subcontractor
- 5220 Project B – HVAC Subcontractor
This granular structure lets the owner see exactly where the money is going on each job, helping them spot cost overruns before they can sink a project’s profit margin.
Now, let's pivot to a SaaS company. Their main concern isn't tracking physical materials; it's understanding recurring revenue and the costs of acquiring and keeping customers. Their COA would look completely different, focusing on subscription models and software development.
- 4100 Subscription Revenue
- 4110 Monthly Recurring Revenue (MRR)
- 4120 Annual Recurring Revenue (ARR)
- 4130 Usage-Based Fees
- 6100 Sales & Marketing Expenses
- 6110 Pay-Per-Click Advertising
- 6120 Content Marketing Costs
- 6130 Sales Commissions
- 6200 Research & Development
- 6210 Developer Salaries
- 6220 Server & Hosting Costs
Here, the detail is all about how revenue is made and what it costs to grow. This gives leaders a clear line of sight into crucial metrics like Customer Acquisition Cost (CAC) and Lifetime Value (LTV).
Industry-Specific Account Examples
This need for a tailored COA is true for every industry. A well-designed chart of accounts brings the kind of clarity that's essential for making smart decisions. We've compiled more valuable accounting tips for small businesses that can help you build an even stronger financial foundation.
Let's look at how a few other industries might set up their key accounts.
For a Retail or E-commerce Store:
- Inventory Asset: This needs to be broken down by product category (e.g., 1410 Inventory – Apparel, 1420 Inventory – Accessories).
- Cost of Goods Sold: Must have separate accounts for things like payment processor fees, shipping costs, and packaging supplies.
- Revenue: Should be split by sales channels (e.g., 4100 Online Sales, 4200 In-Store Sales, 4300 Marketplace Sales).
For a Professional Services Firm (e.g., Law Firm, Marketing Agency):
- Revenue: You’ll want to track different service types (e.g., 4100 Retainer Fees, 4200 Project-Based Fees, 4300 Hourly Consulting).
- Liabilities: A specific account for client funds held in trust (e.g., 2500 IOLTA / Client Trust Liability) is non-negotiable and must never be mixed with your operating cash.
- Expenses: Should include accounts for professional development, industry-specific software subscriptions, and professional liability insurance.
The goal of a customized chart of accounts isn't to create more work; it’s to create more clarity. Each custom account should answer a specific question about your business, like "How much are we spending on Google Ads?" or "Which of our services is the most profitable?"
The table below gives you a quick side-by-side comparison, showing how different business priorities lead to very different COA structures.
Sample Chart of Accounts Structures by Industry
This table highlights how the essential accounts for a construction company differ from those of a SaaS business, showcasing why a one-size-fits-all approach just doesn't work.
| Account Type | Construction Company Example | SaaS Business Example |
|---|---|---|
| Revenue | 4100 Contract Revenue - Project A |
4110 Monthly Subscription Revenue |
| Cost of Goods Sold | 5110 Direct Labor - Project A |
5110 Customer Support Salaries |
| Assets | 1500 Construction Equipment |
1500 Computer & Software Assets |
| Operating Expenses | 6100 Equipment Rental |
6100 Cloud Hosting Fees (AWS/Azure) |
Ultimately, building a custom chart of accounts is about figuring out your key financial drivers and creating a framework to measure them precisely. When you do that, your bookkeeping transforms from a simple compliance chore into a powerful engine for strategic growth.
Setting Up Your Chart of Accounts in QuickBooks Online
Alright, enough with the theory. The real magic happens when you get your hands dirty and actually build this thing. Let’s walk through how to take all the concepts we've discussed and apply them directly in QuickBooks Online. This is where you architect the financial backbone of your business.
When you first open QBO, it gives you a generic, one-size-fits-all chart of accounts. It's a decent starting place, but that’s all it is. To get reports that actually mean something to your business, you've got to tailor it. The whole point is to build a structure that tells your company's financial story with clarity.

Step 1: Enable Account Numbers
For some reason, QBO keeps account numbers turned off by default. I think they do it to avoid intimidating new users, but for anyone serious about organized books, enabling them is the very first thing you should do. Numbers are what give your COA a logical flow, making it a breeze to navigate.
Here’s the quick fix to turn them on:
- Click the gear icon (Settings) in the top right and choose Account and settings.
- Select the Advanced tab on the left.
- Find the Chart of accounts section and click the little pencil icon to edit.
- Check the box next to Enable account numbers.
- You'll also want to check the box for Show account numbers.
- Hit Save, then Done.
That's it. With that simple change, you can now implement the numbering system we talked about (1000s for Assets, 4000s for Revenue, etc.) and bring some much-needed order to your financials.
Step 2: Create New Parent and Sub-Accounts
Now for the fun part: building out your custom accounts. This is where you start adding the specific categories that reflect how your business actually makes and spends money.
To add a new account:
- Head over to Accounting in the left menu, then click Chart of Accounts.
- Look for the green New button in the top-right corner and click it.
- A window will pop up where you'll define the new account.
You’ll pick an Account Type (like Expense) and a Detail Type (like Advertising/Promotional). Then you'll give it a clear Name and, most importantly, a Number. If you want to nest it under another account, just check the "Is sub-account" box and pick its parent.
Let's say you want to get a better handle on your marketing expenses. You could create a parent account called 6500 Digital Marketing. Under that, you could add sub-accounts like 6510 SEO Services and 6520 Social Media Ads.
This parent-child relationship is where a customized chart of accounts truly shines. It lets you see the big picture (your total marketing spend) while also giving you the power to drill down into the specific details that drive your business decisions.
Step 3: Best Practices for Managing Your COA
Getting your COA set up is a huge first step, but keeping it clean and useful is an ongoing job. Think of it like a garden—it needs regular maintenance. Keeping your accounts tidy is one of the most critical bookkeeping basics for small business you can master.
Here are a few pro tips to keep things in order:
- Be Consistent with Naming: Use short, descriptive names that anyone can understand. Steer clear of vague catch-alls like "Miscellaneous"—that account almost always becomes a black hole for transactions you don't know what to do with.
- Edit with Extreme Caution: You can easily change an account's name or number. But be very, very careful before you change its Type or Detail Type. Messing with those can retroactively throw off all your past financial reports.
- Deactivate, Don't Delete: When an account is no longer in use, your first instinct might be to delete it. Don't. Deleting an account that has transactions tied to it will wreck your historical data. Instead, just Make inactive. It hides the account from future use but keeps your financial history perfectly intact.
Common Chart of Accounts Mistakes to Avoid
A well-designed chart of accounts is a powerful asset, bringing crystal-clear clarity to your business finances. But a messy one? It quickly becomes a liability, spitting out confusing reports and hiding the very insights you need to make smart decisions. Avoiding a few common pitfalls can make all the difference.
Over the years, I've seen countless business owners fall into the same traps, turning their financial backbone into a source of frustration. Understanding these errors is the first step toward building a clean, efficient chart of accounts that serves you well for years to come.

Creating Way Too Many Accounts
One of the most frequent mistakes is getting too granular. It usually starts with good intentions—the desire to track every single penny with extreme detail. Before you know it, you have a bloated and unwieldy chart of accounts that's impossible to navigate.
When your profit and loss statement is ten pages long because you have separate accounts for pens, paper, and printer ink, you've lost the big picture. The goal is clarity, not complexity.
A chart of accounts should be detailed enough to be useful, but simple enough to be usable. If an account doesn't help you make a specific business decision, it might just be adding unnecessary noise.
Instead of creating a new account for every minor expense, use parent and sub-accounts strategically. This lets you group related costs like "Office Supplies" while still giving you the power to drill down into the details when you actually need to.
Using Vague Naming Conventions
Another classic error is using unclear or inconsistent names for accounts. If you have accounts named "Miscellaneous" or "Other Expenses," you've created a financial black hole. Transactions get dumped there, and you lose all ability to analyze that spending accurately.
Your account names should be short, descriptive, and instantly understandable to anyone who looks at your reports.
- Vague: "Software"
- Clear: "Software Subscriptions"
- Vague: "Contractor"
- Clear: "Subcontractor – IT Services"
Likewise, having both "Utilities" and "Utility Expenses" causes confusion and guarantees transactions will be miscategorized. Pick one clear system and stick with it. If you're struggling to differentiate between what you owe and what you're owed, our simple guide on accounts payable vs. accounts receivable can help clear things up.
Sticking with the Default COA
Just because your accounting software gives you a generic chart of accounts doesn't mean you should use it as-is. Think of it as a starting point, not a finished product. It isn't tailored to what makes your business tick. A construction company needs to track job costs, while a retailer needs to track inventory by category—defaults rarely accommodate this level of detail.
This is especially true for companies operating in different countries. While there isn't one universal COA, international frameworks like IFRS and national standards like US GAAP heavily influence how accounts are structured. Businesses in multiple countries often need to map their local COA to a corporate one for consolidation, a compliance headache a default setup can't solve. You can learn more about how US GAAP shapes account structures at IFRS-GAAP.com.
Failing to customize your COA means your financial reports will never tell the full story of your business.
Neglecting Regular Reviews
Finally, a chart of accounts is not a "set it and forget it" tool. Your business changes, and your COA needs to change with it. If you never go back to review it, it will inevitably get cluttered with old, unused accounts from past projects or services you no longer offer.
Set a calendar reminder to review your COA at least once a year. This is your chance to do some housekeeping:
- Deactivate unused accounts to clean up your reports.
- Merge duplicate accounts that were created by mistake.
- Add new accounts to track emerging revenue streams or important expense categories.
A little regular maintenance ensures your chart of accounts remains a relevant and powerful financial tool.
Knowing When to Call in a Professional
While you can definitely set up and manage your own chart of accounts when you're starting out, there’s a natural tipping point in every business’s life. Eventually, the financial side of things just gets too complicated to handle on your own.
Recognizing when you've hit that point is one of the most important things you can do for the health of your business. The goal isn't just to track numbers; it's to build a financial backbone that can support your company as it grows.
Think of it like this: your business is expanding, which is exactly what you want. But that success brings complexity. Maybe you’re branching out into new markets, bringing on more staff, or juggling different ways of making money. All of a sudden, that simple chart of accounts you built last year is spitting out reports that are a confusing mess, leaving you with more questions than answers.
Red Flags That Signal It's Time for Help
Getting an expert involved isn’t a sign of failure—it’s a smart, strategic decision. If any of the following scenarios sound a little too familiar, it's probably time to have a conversation with a professional bookkeeper or accountant.
- You're Seeking Investment or a Loan: Banks and investors need to see financials that are clean, professional, and easy to understand. A messy chart of accounts is a huge red flag that can put your funding at risk before you even get your foot in the door.
- You're Preparing for an Audit: Audits are stressful enough without having to worry about your books. A disorganized chart of accounts can turn an audit into a full-blown nightmare, leading to wasted time, extra costs, and potential penalties.
- Your Reports Are Confusing: If you can’t look at your financial reports and immediately understand your profitability or track your most important metrics, your chart of accounts isn't doing its job.
- Your Business Model Has Changed: If you've added a new service, started selling online, or launched a subscription model, your old COA probably can't keep up. You need to adapt it to track those new revenue streams and costs accurately.
Calling in a professional isn't an admission of defeat; it's an investment in your company's future. It's about shifting your focus from managing tedious administrative tasks to making strategic decisions based on clear, reliable financial data.
Ultimately, bringing in a firm like Bugaboo Bookkeeping to redesign or clean up your chart of accounts is a forward-thinking move. An expert will make sure your financial setup isn't just correct for today but is also strong enough to handle whatever comes next, keeping you compliant and ready for growth.
Your Chart of Accounts Questions, Answered
Once you get the hang of the chart of accounts, you start running into real-world questions. Let's tackle a few of the most common ones that business owners ask.
How Many Accounts Should I Have?
There's no magic number here. The "right" number of accounts is all about your specific business and what you need to track. A freelance writer might get by just fine with 30-50 accounts, but a general contractor juggling multiple jobs will likely need over 200 to track everything properly.
The goal isn't just to add more accounts; it's to add the right ones. Each account should give you a piece of information you can actually use to make a decision. If an account doesn't offer any real insight, it's probably just clutter. It's always a matter of quality over quantity.
Can I Change My Chart of Accounts Later?
Of course. Your business isn't static, and neither is your chart of accounts. It's a living tool that should grow and adapt right along with you. When you launch a new product line, expand to a new location, or pivot your strategy, your COA will need a tune-up to keep pace.
Just be careful when making changes. Adding new accounts is usually straightforward. But messing with or deleting old ones can throw your historical data into chaos. The best practice is to deactivate accounts you no longer use. This tucks them away so they can't be used for new transactions, but it keeps your past financial reports intact.
Treat your chart of accounts like any other important tool—it needs a bit of maintenance to work well. A quick review once a year is a great habit to get into. It ensures your COA is still giving you the financial clarity you need.
What Is the Difference Between an Expense and COGS?
This is a big one, and getting it right is fundamental to understanding your profitability. While both are costs of doing business, they tell completely different stories.
- Cost of Goods Sold (COGS): Think of these as the direct costs tied to what you sell. If you're a coffee shop, it’s your coffee beans and milk. If you’re a home builder, it’s the lumber and drywall.
- Expenses (Operating Expenses): These are the indirect costs of keeping the lights on. We're talking about things like rent for your office, your marketing budget, software subscriptions, and salaries for your admin team.
Keeping these two categories separate is non-negotiable. It’s what allows you to calculate your gross profit, which tells you how efficient your core business operations are. Any well-built chart of accounts will have a dedicated section for COGS that is completely separate from your day-to-day operating expenses.
A well-structured chart of accounts is the bedrock of financial clarity. If yours feels more like a tangled mess than a clear blueprint, the team at Bugaboo Bookkeeping can help. We specialize in cleaning up, customizing, and maintaining books for established Washington small businesses. Schedule your free consultation today!

